|
|


News
By Seval Altug | International | 17.07.2026 12:52
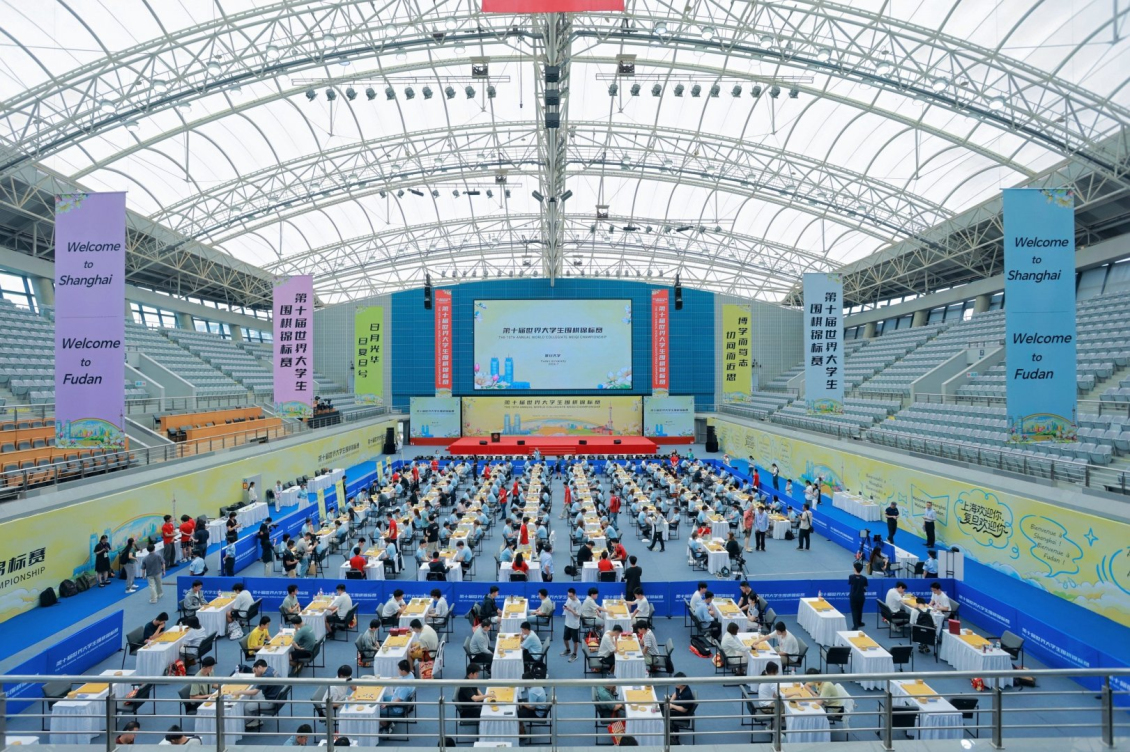
Around 150 players from 101 universities across 37 countries and regions gathered in Shanghai for the 10th World Collegiate Weiqi Championship, combining high-level competition with cultural exchange and international friendship.
Read more...
By Milena Boclé | News | 16.07.2026 14:12
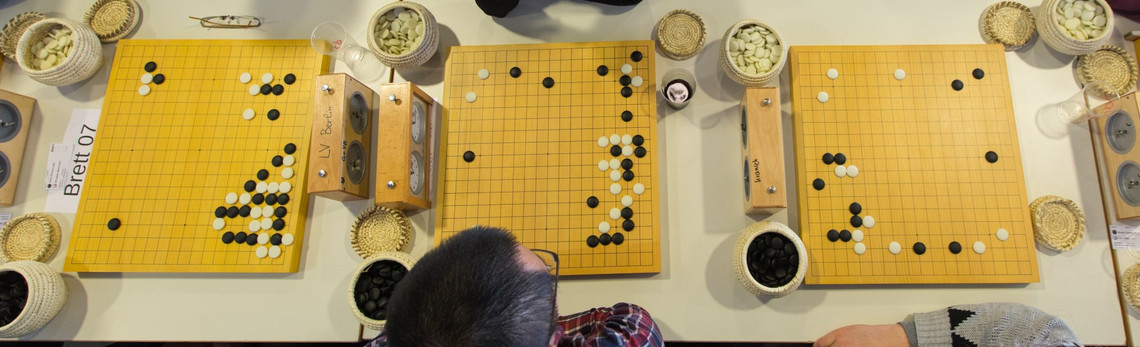
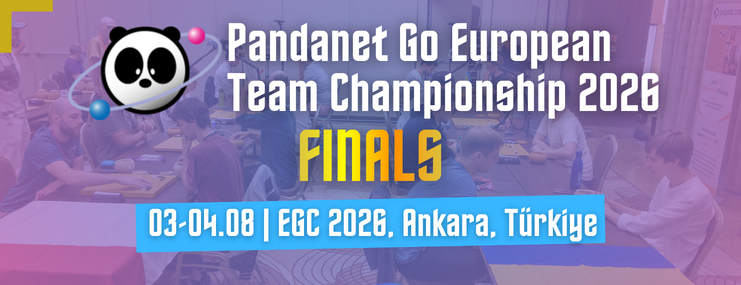
The 16th Pandanet Go European Team Championship - "PGETC" - (almost) ended after a year of thrilling online games in several leagues. The ultimate matches of the A league will take place in real life at the EGC 2026 in Ankara, Türkiye, in early August with Ukraine, Czechia, France and Germany.
Read more...
Read more...
By Milena Boclé | International | 06.07.2026 8:33
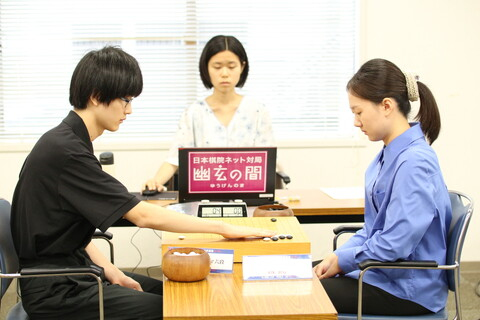
The winner of the European Youth Go Championship U21 2026, Yuze Xing 6d from Germany, was invited in Japan at the end of June to play in the 11th edition of the Globis Cup, a major world event for top pros and invited strong amateurs under 22 years old.
Read more...
By Artem Kachanovskyi | News | 05.07.2026 14:30
European Go Journal July 2026 Newsletter
Read more...

By Seval Altug | News | 03.07.2026 3:20
The inaugural EGF Go Development Summit is almost here! The complete programme, speaker lineup, and session details are now available. Join academics, educators, federation leaders, and members of the Go community in Ankara, for four afternoons of interactive discussions shaping the future of European Go.
Read more...
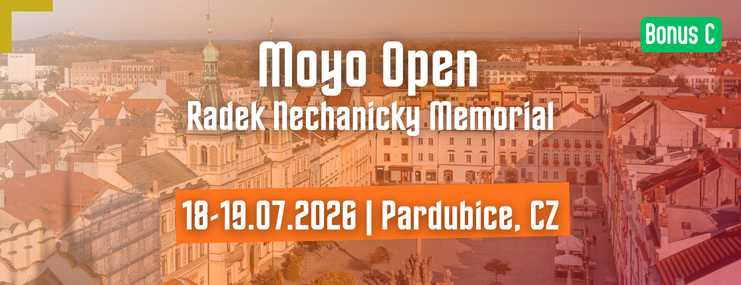
The Moyo Open 2026 – Radek Nechanicky Memorial is coming soon to Czechia, Pardubice, on 18th – 19th of July 2026! this year will be the 25th edition, join us!
Read more...
Read more...
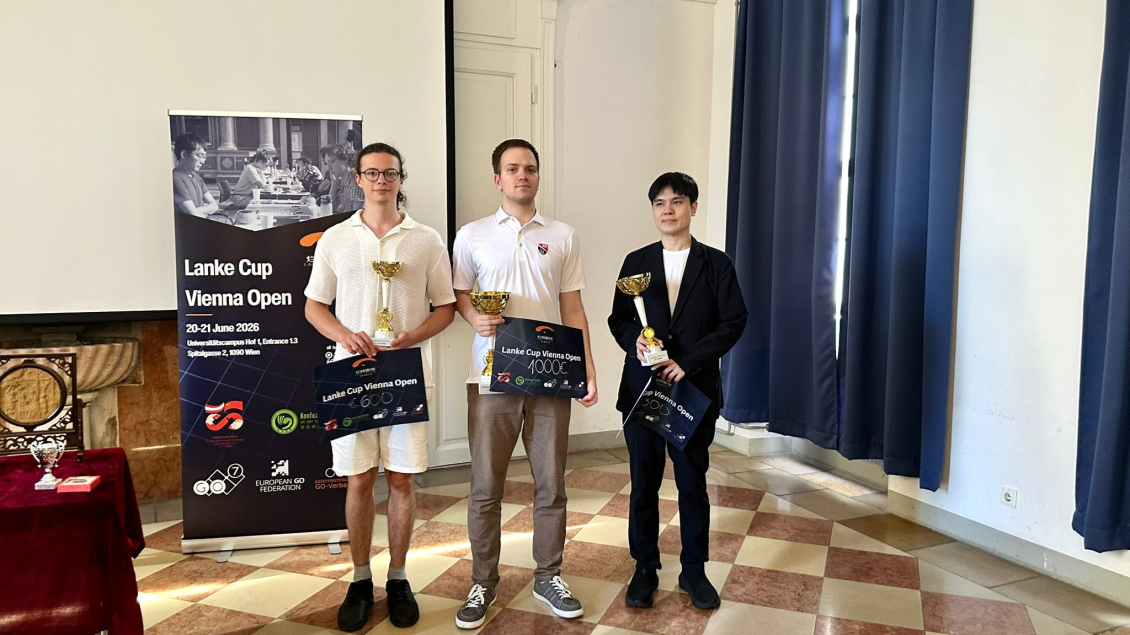
By Seval Altug | News | 23.06.2026 10:43
The 3rd Lanke Cup Vienna Open was held on 20–21 June 2026 in Vienna with 85 players from 18 countries. Valerii Krushelnytskyi 7d won the tournament after a closely contested final round, finishing ahead of Kim Dohyup 8d and Ioan Elian Grigoriu 6d on tiebreak.
Read more...
![EGF Pros at the Chinese C League! [June 6 - 15]](https://eurogofed.org/newsp/upload/original/564_CCL.png)
By Milena Boclé | International | 06.06.2026 8:45
The annual team competition, the Chinese C League, just started in Hangzhou, China, lasting from June 6 to 14. Europe is invited to play in the Tsinghua Weiqi Foundation Team. Andrii Kravets 3p, Stanislaw Frejlak 2p, Benjamin Dréan-Guénaïzia 1p and Tanguy Le Calvé 1p will fight against 30 other teams in this 8 rounds event!
Read more...
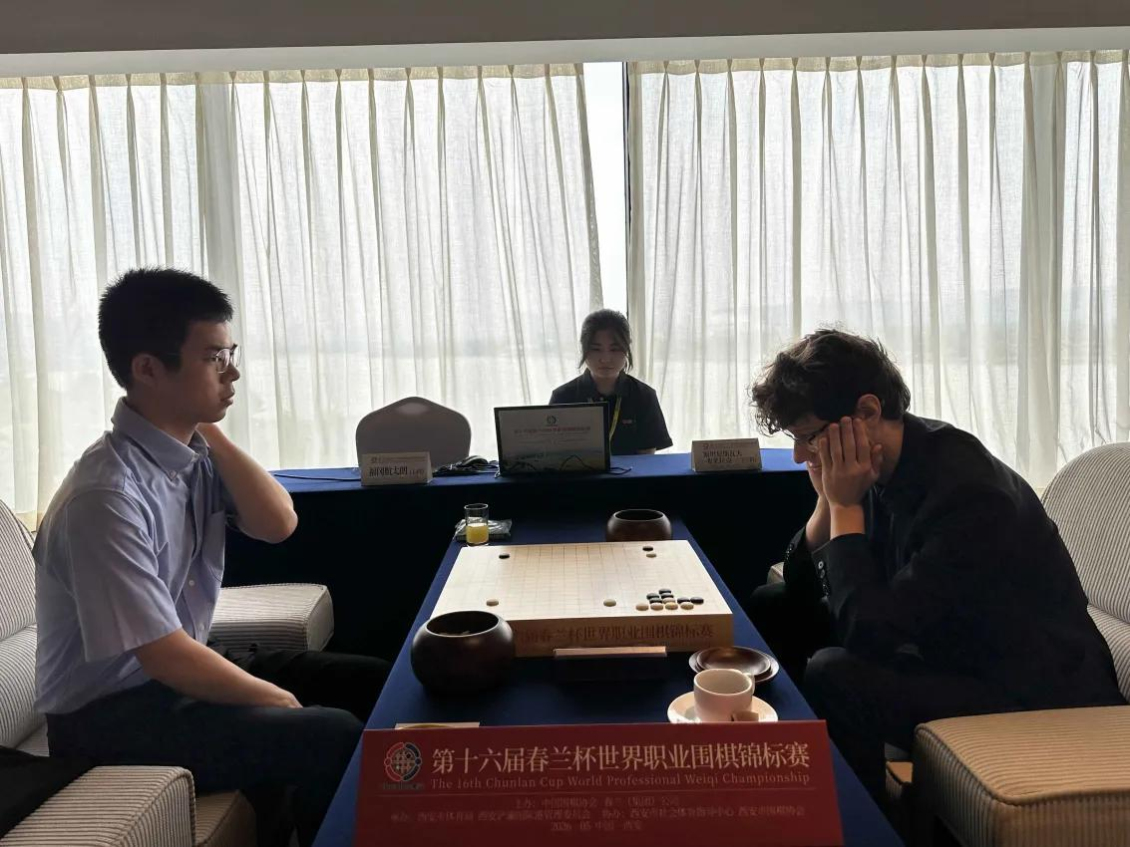
By Stanisław Frejlak | International | 27.05.2026 14:11
On May 23rd in Xi'an, China, began the 16th Chunlan Cup, a prestigious tournament gathering together the best players in the world. Stanislaw Frejlak 2p was invited as the European Representative.
Read more...

Calendar
| Date | Co | City | Event |
| 16.07.2026 19.07.2026 |
KZ | Almaty | 3rd Kunanbayev Cup |
| 18.07.2026 18.07.2026 |
DE | Muelheim an der Ruhr | 2. DSK Cup 2026 |
| 18.07.2026 19.07.2026 |
CZ | Pardubice | Moyo Open - Radek Nechanicky MemorialC |
| 18.07.2026 19.07.2026 |
DE | Potsdam | Potsdamer Peep |
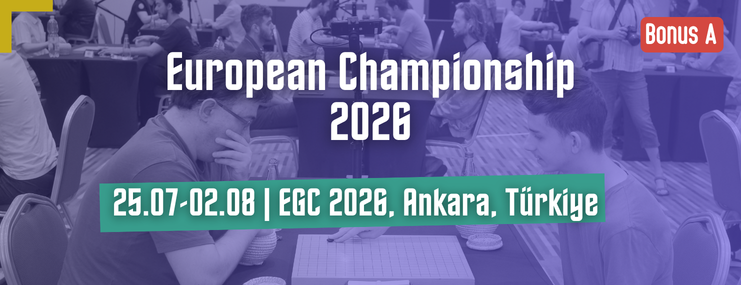
| 25.07.2026 02.08.2026 |
TR | Ankara | European Championship 2026 |
| 15.08.2026 16.08.2026 |
GB | Manchester | NEW!Manchester Open |
| 17.08.2026 23.08.2026 |
ES | Vilanova i la Geltrú | IX Go Seminar NamBan |
| 22.08.2026 23.08.2026 |
AT | Damüls | Ländle Cup + Austrian Go-Camp |
| 25.08.2026 30.08.2026 |
SK | Liptovsky Mikuláš | Summer go retreat |
| 29.08.2026 30.08.2026 |
PL | Bochnia (near Krakow) | Salt Mine Open |
| 29.08.2026 30.08.2026 |
SE | Stockholm | NEW!Stockholm Open 2026 |
| 29.08.2026 05.09.2026 |
HR | Zaostrog | 8th Summer Go Festival |
| 05.09.2026 06.09.2026 |
IT | Pisa | 2nd Pisa International Weiqi CupC |
| 12.09.2026 13.09.2026 |
PL | Wrocław | VIII Wroclaw Open 2026 |
| 12.09.2026 13.09.2026 |
BA | Banja Luka | Banja Luka Open 2026 |
| 18.09.2026 20.09.2026 |
CZ | Brno | 2. Brno září! |
| 19.09.2026 20.09.2026 |
HU | Budapest | Hungarian Cup 2026 |
| 19.09.2026 20.09.2026 |
PL | Rzeszów | VIII Rzeszowski Turniej Go |
| 19.09.2026 20.09.2026 |
TR | İzmir | European Student ChampionshipsEC |
| 25.09.2026 27.09.2026 |
FI | Baltic Sea | Nordic Go Cruise |
| 26.09.2026 27.09.2026 |
DE | Schwerin | 21. Go Tournament Schwerin (Schweriner Turnier) |
| 03.10.2026 04.10.2026 |
GB | London | European Women ChampionshipsEC |
| 10.10.2026 11.10.2026 |
TR | Istanbul | 25th International Istanbul Go TournamentC |
| 24.10.2026 24.10.2026 |
DE | Muelheim an der Ruhr | 3. DSK Cup 2026 |
| 31.10.2026 01.11.2026 |
CZ | Brno | Wube Open |
| 07.11.2026 08.11.2026 |
GR | Athens | NEW!2nd Athens Go Tournament |
| 21.11.2026 22.11.2026 |
HU | Budapest | Hungarian OPENC |
| 28.11.2026 29.11.2026 |
DE | Berlin | 46th Berliner Kranich |
| 05.12.2026 06.12.2026 |
PL | Żołędowo (Bydgoszcz) | PPiK - Grand Prix - Żołędowo 2026 |
| 12.12.2026 13.12.2026 |
HR | Velika Gorica | 10th Velika Gorica City Go TournamentC |
See also the full EGF Calendar and the EGF World Calendar.
You can submit your event by filling this form